Go.Data ArcGIS Pro Resources for GIS users
Go.Data SITREP Toolbox for ArcGIS Pro (v1.0)
Pro Toolbox
Background
GoDataArcGISProSITREP toolbox was developed by the Go.Data team for GIS users to access case and contact data and automate the process of generating situation report (SITREP) maps during an outbreak investigation managed with Go.Data. From within ArcGIS Pro (2.6.3, 2.7.1, 2.8.3, 2.9.2) the toolbox allows a GIS user to extract raw case and contact data and generate pre-programmed variable summaries, with the option to join to GIS data. The summary data can then be used to develop multiple common SITREP maps. Raw data is also extracted and can be explored for further potential maps or geospatial analysis.
The toolbox has an operational impact because it bypasses the need for a GIS user to be familiar with the Go.Data system or to have to wait for data to be distributed from others. This is important when you are producing the same maps on a daily basis throughout the course of an outbreak response. The user simply logs into Go.Data via the toolbox dialog, extracts, summarizes, and joins to a GIS layer supplied by the user.
SITREP map products can be used in briefing and status documents, or printed and used as reference during field operations. Maps can be shared as images and be incorporated into SITREP publications or incident management slide shows and operations dashboards. Please note the toolbox creates the input data for maps - it does not currently contain layout templates.
Metadata for the SITREP summary files, as well as some sample SITREP maps, are located further down on this page. Prior to running the tool, please read the Helpful tidbits section at the bottom of this page to avoid headaches.
SITREP toolbox in action 
Toolbox prerequisites
Prior to using the toolbox, a Go.Data outbreak administrator must add you as a user to Go.Data and provide you the information in the first four bullets below. Currently, the toolbox works with server-based installations of Go.Data.
- Go.Data URL: The URL of your server where Go.Data is, for example: “https://godata.moh.org/”
- Username: The email address you use as a user name to access Go.Data (the administrator sets this in Go.Data)
- Password: The password you use to access Go.Data - if you are using the password for the first time, log into the Go.Data URL in a browser and you will be prompted to change your password. Then use the new password with this toolbox. If you don’t do that step - the tool will not function.
- Outbreak: The name of the outbreak you want to extract data for. Within the toolbox dialog, a drop-down list will populate with outbreaks you have been given access to by the outbreak administrator.
- GIS layer (optional): GIS layer with a unique identifier that matches the Go.Data summary data unique identifier field (LocationID). This is only necessary if you are joining summary data output to a GIS layer. The user must provide this layer - no data is provided with this toolbox. Some GIS data sources are referenced on this page.
- Existing File Geodatabase (required for summary functions): This is required if you are generating the SITREP summary files and if you are joining to an existing GIS layer. The tool will create tables and create new features in the specified file geodatabase.
- ArcGIS Pro: It is assumed that you have access to and familiarity with ArcGIS Pro in order to use the toolbox. The version of Pro that this tool was built on is version 2.8.3 and it also works with 2.6.3, 2.7.1 and 2.9.2. The version of Go.Data that it was built with is 40.2. As there are future releases of either application, we will do our best to test this toolbox with each release.
Get started
Step 1: Download the Go.Data ArcGIS Pro SITREP toolbox from here
Step 2: Open ArcGIS Pro and add the toolbox to your project
To add the toolbox, go to the “View” tab on the ribbon and click on the “Catalog Pane” icon. In your catalog pane, right-click on the “Toolboxes” item, select “Add Toolbox”, and then navigate to the folder where you downloaded the toolbox to add it.
Step 3: Open “Create SITREP tables” dialog
Click on the Go.Data toolbox drop down to see the Create SITREP Tables dialog. Highlight it, right-click and select ‘Open’. This will open the dialog shown in the figure below.
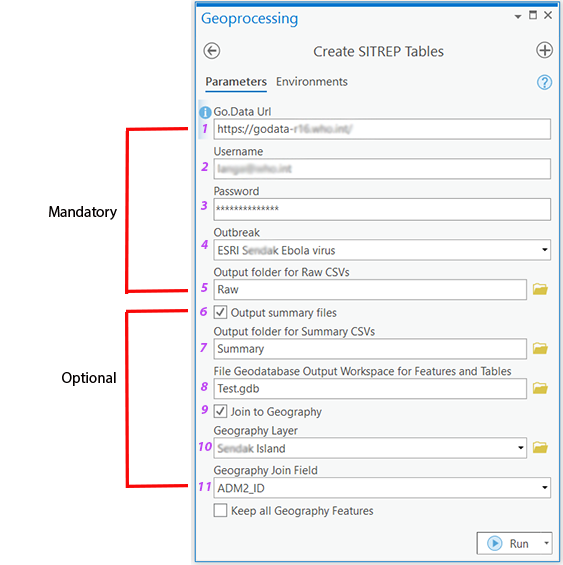
Step 4: Fill in the mandatory parameters (1-5 in dialog graphic above)
- Add the link to the Go.Data site (1), your user name (2), and your password (3).
- Hit the tab button from the password section, and the next section, Outbreak, will populate a drop-down list of outbreaks you have access to. Sometimes this can be a little slow - depends on your internet speed. The tool is accessing the Go.Data site via API endpoints using your credentials.
- Select the outbreak (4) you want to extract from.
- Specify the folder (5) you want the raw csv file outputs written. NOTE: If you would just like raw data extracts, you can just click the ‘Run’ button at this point.
Step 5: Fill in Summary data parameters (optional)
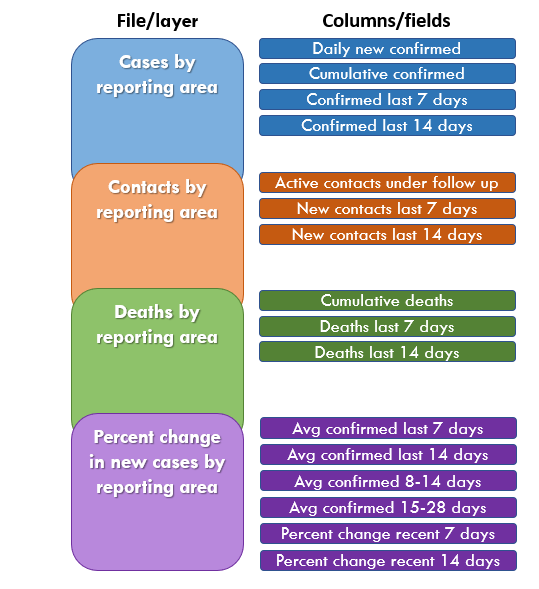
In order to create the SITREP summary output, complete items 6 - 8. Summary data includes 16 variables summarized by reporting area, so they can be mapped.
- Check the box (6) next to ‘Output Summary files’.
- Specify folders (7) where you want to store your summary csv outputs.
- Specify a file geodatabase (8) to write the summary tables (it will also create csvs). It can be an existing one, or you can create a new one prior to running tool. This is actually done in preparation for the next step.
Step 6. Fill in Geography join parameters (optional)
If you would like to map the summary data, you will need to join it to a GIS layer. Complete steps 9 - 11 to join your summary data and GIS layer.
- Check the box next to ‘Join to Geography’ (9).
- Specify the GIS layer that you want the summary table to join to (10).
- Specify the field in your GIS layer that will match the summary data (11). Note that the user must know if the locationID in the summary data will match the GIS layer beforehand. If you are unsure, just run the tool without joining to see the values in the LocationID field in the summary or raw data. Compare those values with your GIS dataset and proceed accordingly - you may need to manually manipulate the data to match fields for a join.
Step 7. Click on the ‘Run’ button!
The tool is grabbing data from the Go.Data server and then summarizing the data so the size of the outbreak and your bandwidth will affect the time it takes to process.
Step 8. Create maps using the output!
(See samples below)
Description of tool outputs
Outputs of the tool include raw data, summarized indicators typically reported in an outbreak response, and new GIS features with summary data. Further details are provided below.
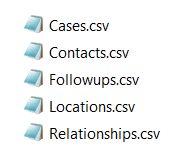
Raw data
Five csvs of raw outbreak data. This data is returned from Go.Data API endpoints for cases, contacts and locations. It includes most of the core variables that are collected during an outbreak investigation. For more information about the fields in the raw csv output, please consult Go.Data metadata here for a more complete list of data collected in the Go.Data system.
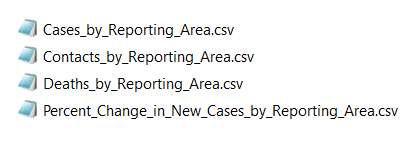
Summary data
Four SITREP summary tables with 16 total calculated fields, each of which could be used to create a separate map. Contents described in next section.
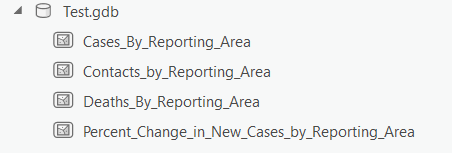
Feature classes
Four feature classes in the file geodatabase provided by user. Each feature class includes its associated summary data.
SITREP summary metadata
The following graphic illustrates the files and associated fields (16) that are calculated as part of the SITREP summary output. These fields are also included in the GIS features output. Note that fields are calculated as of the previous day. For instance, if you run the tool to map the value for confirmed cases last 7 days, that value would consist of the previous day (which is the day prior to running the tool), and the 6 days prior. This is because typically numbers published for a response (or for a daily IM meeting), are “as of” the previous day.
The data dictionary table below shows the fields in each SITREP summary output file including a description of how each field value is calculated. 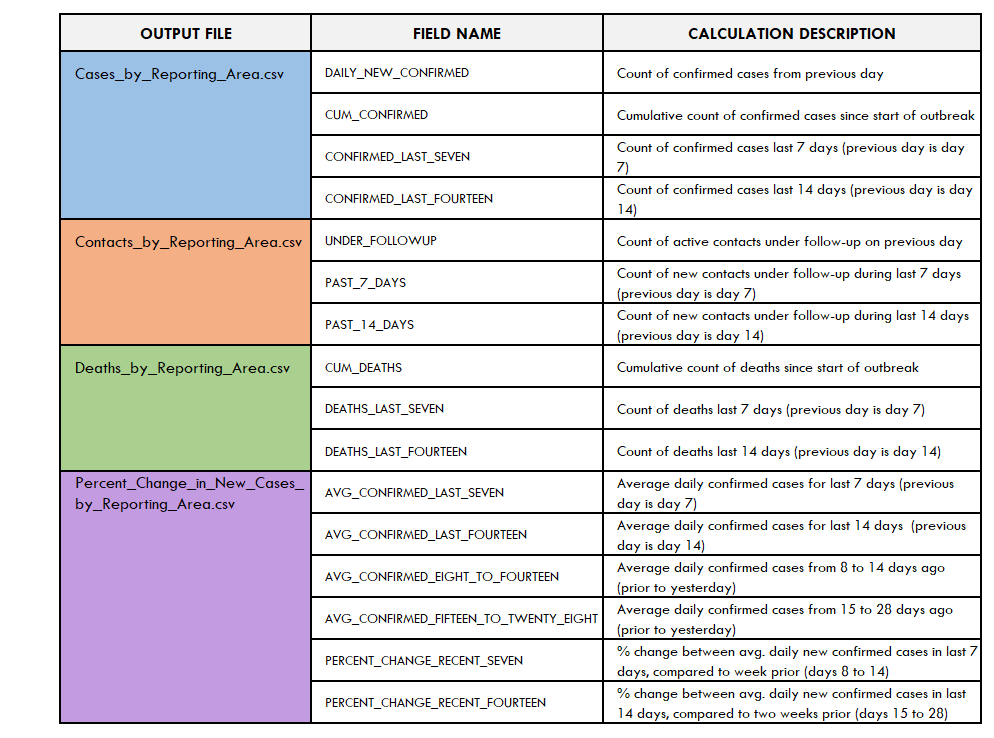
Sample SITREP maps
Below are some sample SITREP maps using fictional data (outbreak and geography). Note that these are just a few that can be created with the summary tables from this tool. The toolbox creates 16 calculated fields as a result of the summary function and they are also part of the GIS features created. You could combine some of these fields as separately symbolized layers within a map, and they can be combined with user provided data. For instance, if a user has population data, they can calculate the case rate with the case summary output.
(Fictitious Island in graphics below)
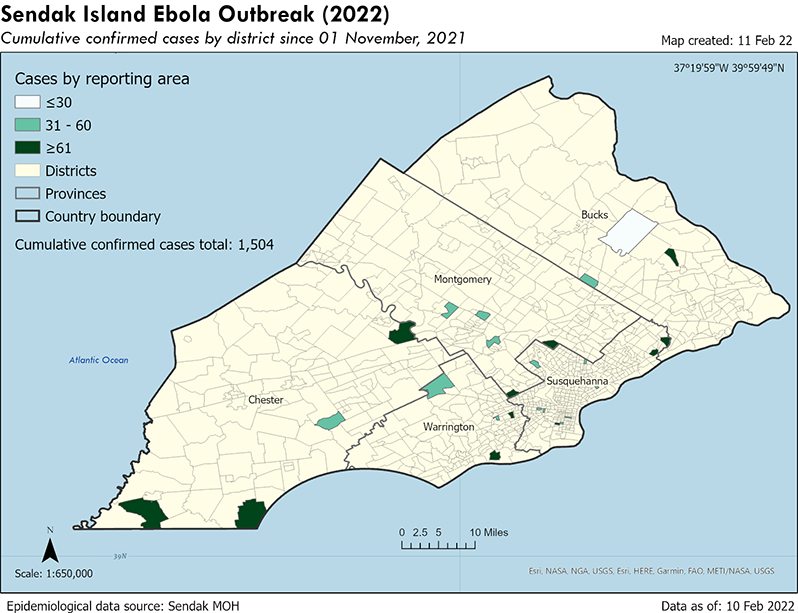
1. Cumulative number of confirmed cases
Captures the total number of confirmed cases by reporting area since the beginning of the outbreak. Areas in dark green are districts with the highest number of confirmed cases since the start of the outbreak. Areas with a pale green color have had the lowest number of infections.
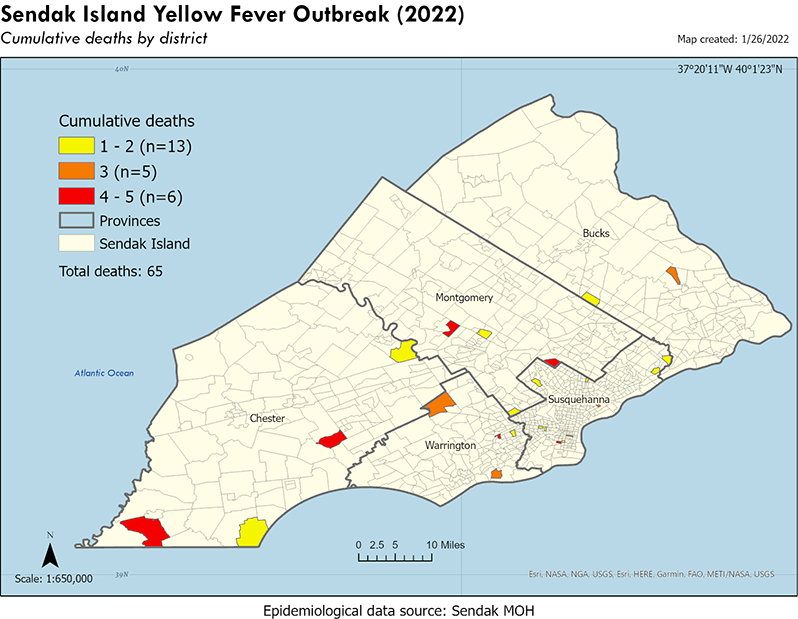
2. Cumulative number of deaths
Cumulative deaths is one measure of the effect of an outbreak as it shows all deaths since the start of the outbreak. This map shows districts with varying levels of deaths. Another way to use death data would be to look at it in time periods after interventions such as quarantine, social distancing, mask-wearing, etc. This would indicate if those measures had an effect. Both 7-day and 14-day counts are also included in the SITREP summary data.
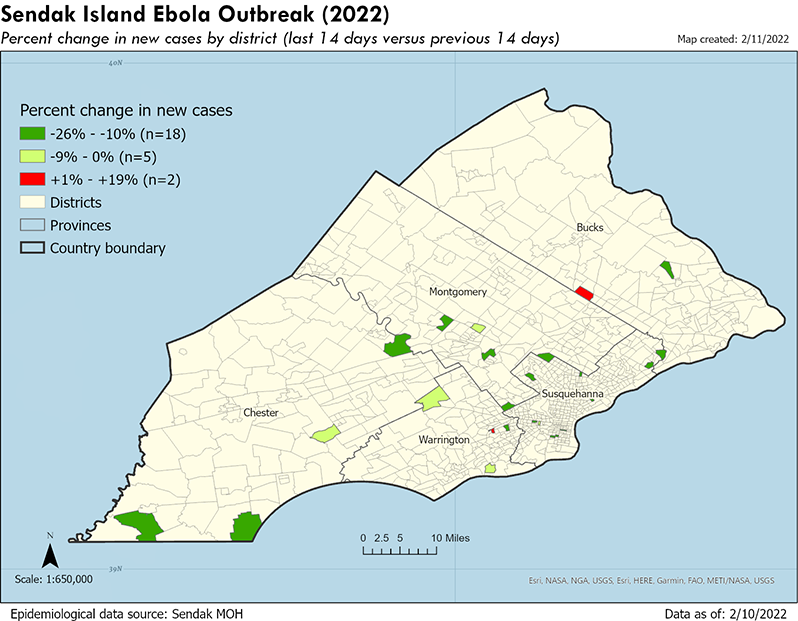
3. Percent change in new confirmed cases
Shows the trend in the average daily number of new cases over the last two weeks versus the two weeks prior. Shades of green indicate districts with a downward trend in new cases. Conversely, districts with red are experiencing an increase in new cases. The legend also indicates the number of districts (n=x) within each classification. From that, we see that 23 of the 25 districts are improving.
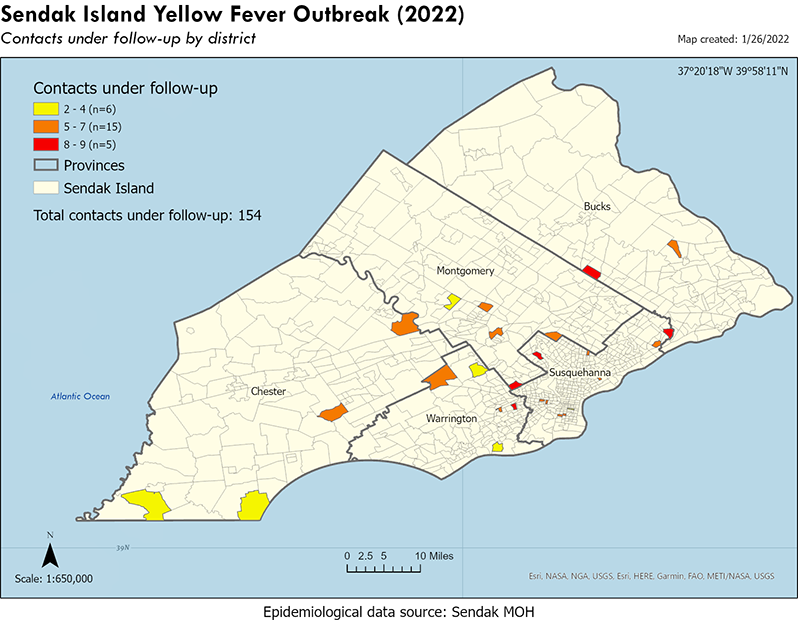
4. Contacts under follow-up
Shows the daily number of contacts of cases that are actively being monitored. The map shows graduated classifications by district and identifies the five districts with the most contacts under follow-up. In areas with high numbers of contacts under follow-up, this could indicate that intervention measures are not working or there is non-compliance.
Helpful tidbits…
- Prior to running the toolbox for the first time, log into Go.Data URL via a web browser. You will be prompted to change your password. Change your password and make sure you save it somewhere. If you should lose it or forget it, you must contact the outbreak administrator directly (not through Go.Data) to send you a new one, and you will repeat the process of renaming that password prior to running the tool again.
-
For the URL link portion of the SITREP Toolbox dialog, make sure you just enter up to the top-level domain, not any sub-directories.
Example: GOOD: https://godata.MOH.int/ BAD: https://godata.MOH.int/auth/login - If you run into any issues with the mandatory section of the dialog, and get errors such as “authorization required”, it is login or persmissions-related with Go.Data. First, make sure you entered your username and password correctly. If that isn’t the issue, contact your Go.Data outbreak administrator for resolution.
- It is best practice to always run the tool on a new session of Pro. Meaning, if you run the tool once, and need to re-run it, then first save it (if desired), close the project, and re-open the project before running it again. This should clear out any dangling processes.
- The output files of the tool (csvs, file geodatase tables and features), have hard-coded file names. Because of this, the files will be overwritten the next time you run the tool if you point to the same folders and file geodatabase. If you don’t want it to overwrite, save to different folders, or you can rename the files after running the tool so they won’t be overwritten the next time you run it. The same goes for the features and tables in the file geodatabase; you can rename them to maintain them so the next time you run the tool it doesn’t overwrite them or you can point to a different file geodatabase.
- In a best case scenario, the outbreak administrator utilized an official GIS data source with admin names and unique identifiers to set up the location data in the Go.Data system. You may want to ask the administrator or your map requestor if that is the case. If it was, and you have access to the GIS layer, the joins will be seamless. If not, you will have to manually adjust either the summary output or your GIS data set to make them match.
If you would like more information or if you have feedback, please email godata@who.int and add “GIS:” at the beginning of the subject line.