Interacting with Go.Data in R
Go.Data R Packages
R Package
godataRpackage was developed to assist with connecting to your API and extracting large volumes of data into R for further analysis. If you would like more information or if you have feedback, please email godata@who.int. If you are experiencing a bug or have a feature request, please submit an issue herelab2godatapackage was developed to allow Go.Data users to easily match new laboratory results with existing cases or lab records in Go.Data, in order to create new Go.Data lab records or update them, respectively. If you are experiencing a bug or have a feature request, please submit an issue here- if you have ideas for further package development, we would love to hear from you!
Canned RMarkdown Reports
Reference Template
- See the
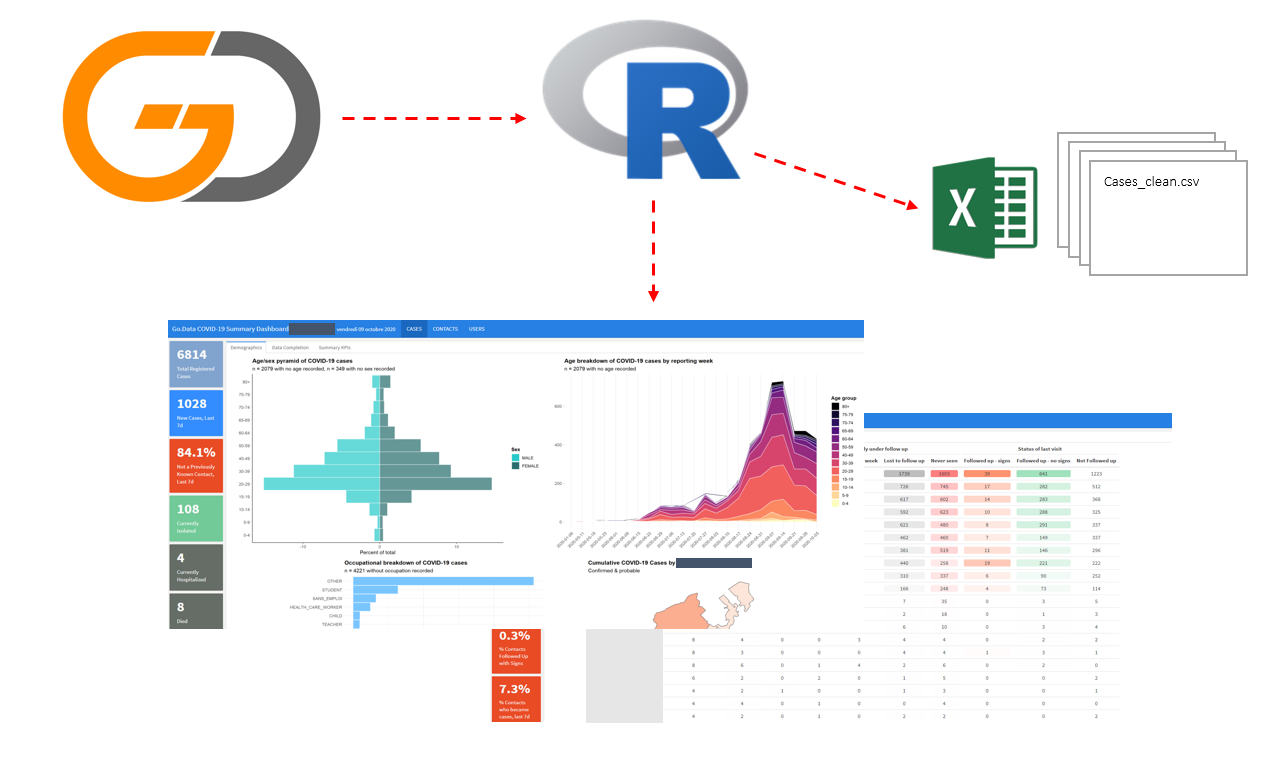
godata-r-reportsrepo for scripts and associated SOPs for how to extract data from Go.Data API (usinggodataRpackage - see below) directly into your R console, perform cleaning functions, examples of resulting HTML dashboards usingflexdashboard. - if you have visualizations you would like to contribute to this, please submit a pull request or email godata@who.int.
Shiny Apps
Shiny Apps have been produced across the Go.Data Community of Practice that can serve as reference templates for those who wish to have a live application updated in real-time, versus static reports. Countries and institutions who would like host these on their Go.Data server can start with these frameworks and adapt it with hopefully minimal updates required.
lab2godata
Reference Template
The lab2godata package has been developed with a broad user base in mind; a central feature is the lab2godata shiny app, which can be launched from the user’s desktop with the click of a button, or if preferred, by running the runlab2godata() command within RStudio. The app provides an intuitive interface that allows users to upload a file of laboratory data and choose how they wish to match this data with existing Go.Data records. Once choices are submitted, the app will produce a summary of the successful matches and a more detailed match report line list. The match report and a clean file of matched data ready for importing into Go.Data are then available for download.
Reference Go.Data R Shiny App Template
Reference Template
This Shiny App builds on Go.Data RMarkdown resources allowing for more interactive components for filtering and drilling down into data on a more granular basis.
GoContactR
Country Use Case
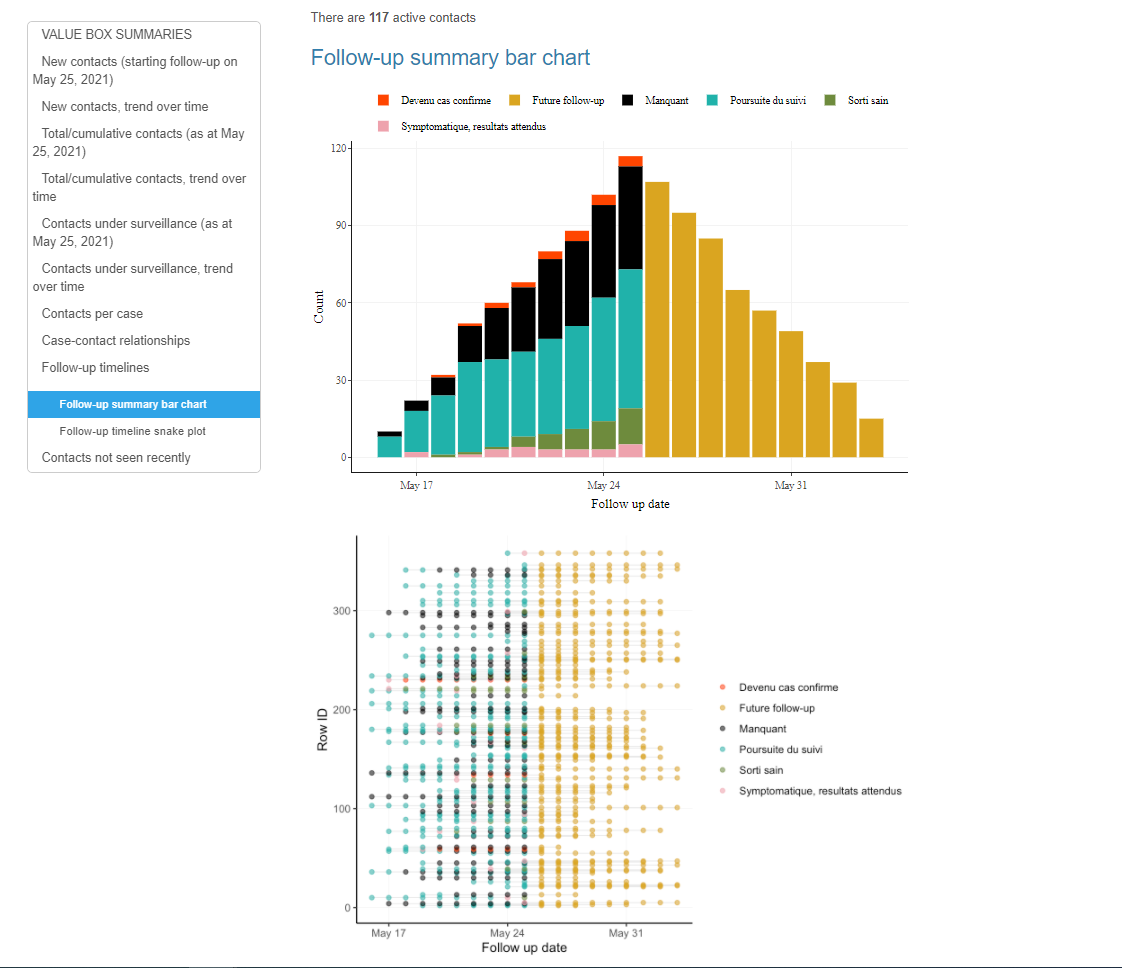
GoContactR is a Shiny App developed by colleagues in the WHO Regional Office for Africa which takes Contact Tracing Data and performs a range of visualizations, including data quality/completeness, contact tracing performance and HTML/PPT output for presentations. It is adapted for a range of data sources across several countries, including Excel imports, the Go.Data API or KoBo Collect. You can view complete documentation, video walkthroughs and setup instructions here.
Go.Data Guatemala Shiny App
Country Use Case
This Shiny App infrastructure was built by the Go.Data team in Guatemala from the to view case/contact data from Go.Data API.
R Helper Scripts
working with the API
working with .shp files
- Script to get centroids from .shp files (needed for point locations in Go.Data)
Resources for R Capacity Building
Epi R Handbook
- If you would like more resources on how to use R for outbreak analysis, you can refer to the The Epidemiologist R Handbook - https://epirhandbook.com/
- Written for epidemiologists by epidemiologists, this free, open-access manual provides sample R code and tutorials addressing a wide variety of data management and visualization tasks with practical epidemiological examples. It is available in an offline version for use in settings with low internet-connectivity, and is great for those looking to transition to R from SAS, Stata, SPSS or Excel.
- Regardless of tool used for data capture, management and analysis, we believe it can be an excellent resource for those doing field-level epidemiological analysis.
- Of note, this handbook includes how-to steps on how you might visualize Contact Tracing using sample Go.Data output, in the “Contact Tracing” page. It also discusses how you could connect to the Go.Data API in the “Import and Export” page.