The sfPortioning() function represents the portioning of a pack of RTE seafood into a smaller unit to be consumed. It is assumed that the microbial cells present in a contaminated pack
are distributed into servings following a beta-binomial distribution, although the algorithm only retains one portion per pack (and not all the portions that can be obtained from a pack).
The dispersion factor bPortSF represents the extent of cell clustering in the RTE seafood within the package.
Usage
sfPortioning(
  data = list(),
  nLots = NULL,
  sizeLot = NULL,
  unitSize = NULL,
  servingSize,
  bPortSF
)
Arguments
- data
a list with a minimum element:
- N
(CFU) A matrix of size nLots lots by sizeLot pack units containing the numbers of L. monocytogenes per pack before handling at home.
- nLots
Number of lots sampled or size of the Monte Carlo simulation (scalar).
- sizeLot
Number of units or portions produced in a lot (scalar).
- unitSize
(g) is the weight of a pack of RTE seafood (scalar).
- servingSize
(g) is the portion taken from a pack, which will later equals to the serving size (scalar or vector).
- bPortSF
dispersion factor of cells within the package (scalar or vector).
Value
the data object with modified:
- N
(CFU) A matrix of size nLots lots by sizeLot units containing the numbers of L. monocytogenes in the portions of RTE seafood.
Note
A dispersion factor bPortSF=1 represents moderate clustering of cells ((Nauta 2005)
) in the RTE seafood within the package.
The serving size servingSize should be provided by the user and/or could be tested in scenarios.
References
Nauta MJ (2005). “Microbiological risk assessment models for partitioning and mixing during food handling.” International Journal of Food Microbiology, 100(1), 311–322. doi:10.1016/j.ijfoodmicro.2004.10.027 .
Team RC (2022). R: A Language and Environment for Statistical Computing. R Foundation for Statistical Computing, Vienna, Austria. https://www.R-project.org/.
Author
Ursula Gonzales-Barron ubarron@ipb.pt and Regis Pouillot rpouillot.work@gmail.com
Examples
nLots <- 1000
sizeLot <- 500
dat <- list(
N = matrix(rpois(sizeLot * nLots, 10),
nrow = nLots, ncol = sizeLot
), P = 0.16,
ProbUnitPos = rep(0.16, nLots)
)
Nf <- sfPortioning(dat, servingSize = 150, unitSize = 500, bPortSF = 1)
str(Nf)
#> List of 6
#> $ N : int [1:1000, 1:500] 3 7 1 2 1 4 6 0 5 1 ...
#> $ P : num 0.16
#> $ ProbUnitPos : num [1:1000] 0.16 0.16 0.16 0.16 0.16 0.16 0.16 0.16 0.16 0.16 ...
#> $ lotMeans : num [1:1000] 0.0227 0.0245 0.0228 0.0224 0.0233 ...
#> $ unitsServing: num [1:500000] 0.02 0.04667 0.00667 0.01333 0.00667 ...
#> $ servingSize : num 150
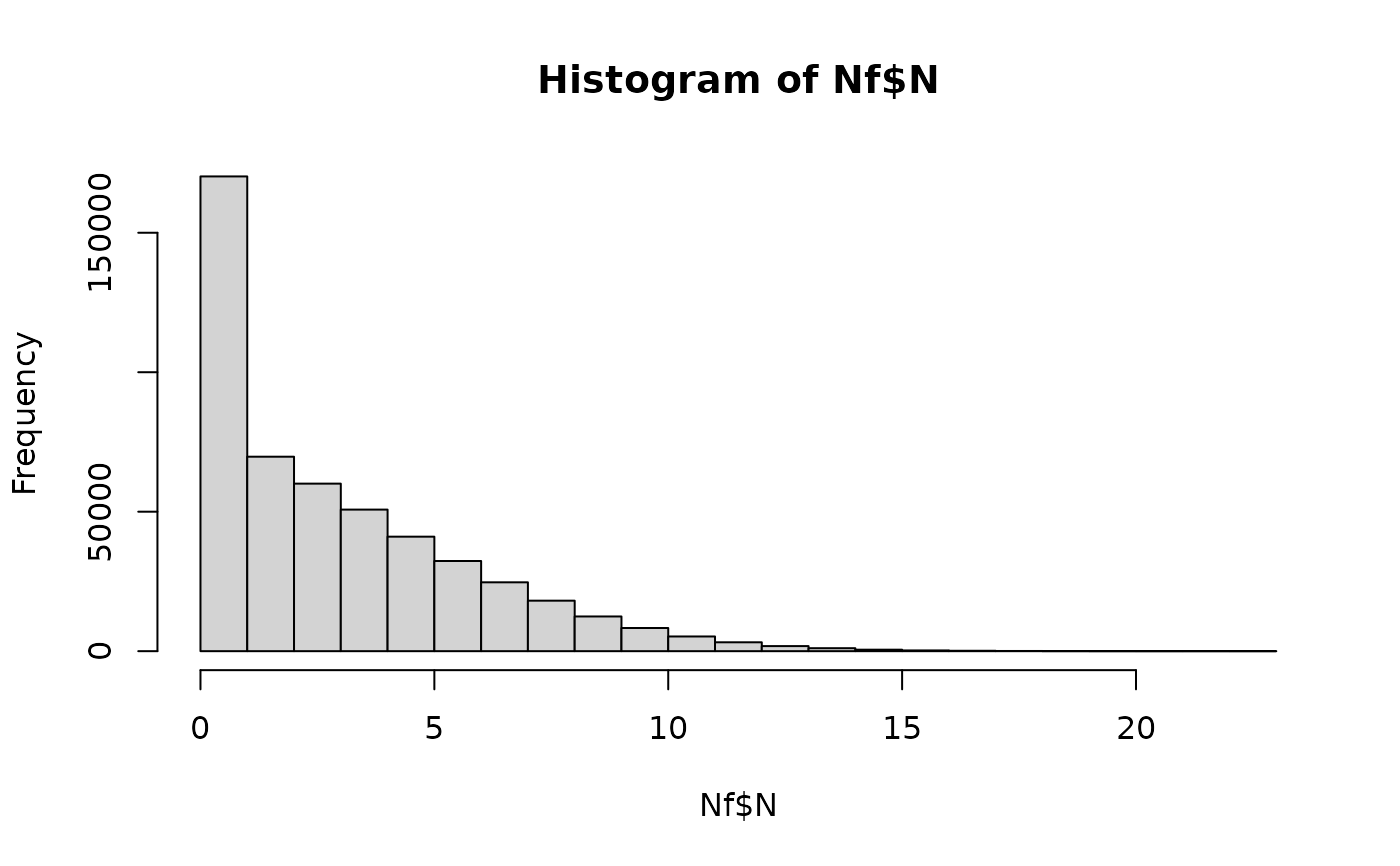
hist(Nf$N) # histogram of microbial cells in contaminated servings