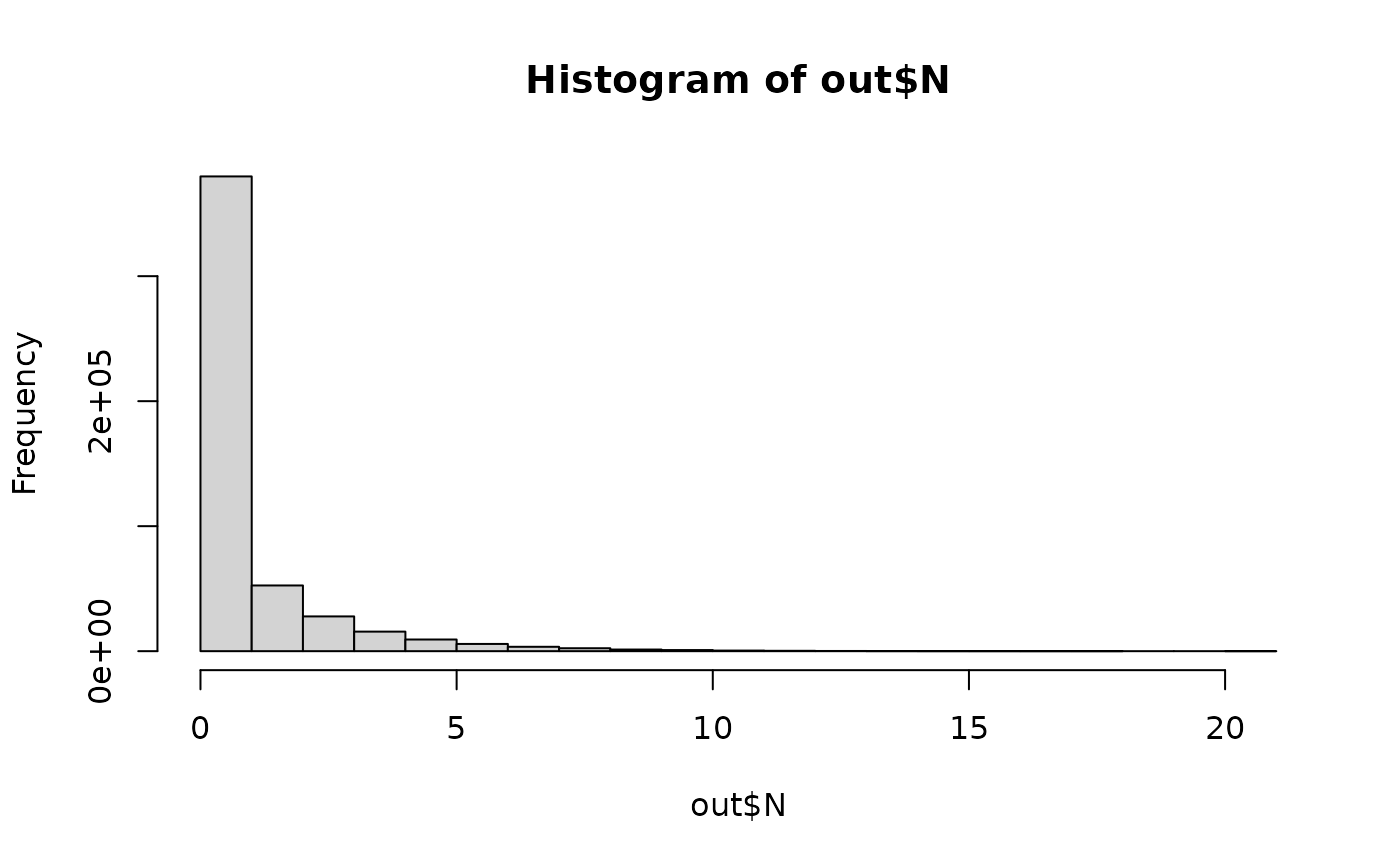
Effect of a potential intervention step post-packaging
Source:R/fvReductionPostpack.R
fvReductionPostpack.RdThe function fvReductionPostpack() describes the effect of any potential intervention step that would
be applied on packed frozen vegetables in order to reduce the occurrence of L. monocytogenes.
It is intended that the user proposes as inputs the minimum, mode and maximum of the log10 reduction for this intervention (MRA46).
Usage
fvReductionPostpack(
  data = list(),
  nLots = NULL,
  sizeLot = NULL,
  logIntervMin,
  logIntervMode,
  logIntervMax
)
Arguments
- data
a list of:
- N
(
CFU) A matrix of sizenLotslots bysizeLotunits representing the numbers of L. monocytogenes per pack unit, before the intervention;- ProbUnitPos
Probability of individual lots being contaminated before the intervention (vector);
- P
Mean prevalence of contaminated lots before the intervention (scalar).
- nLots
Number of lots sampled or size of the Monte Carlo simulation (scalar).
- sizeLot
Number of units or portions produced in a lot (scalar).
- logIntervMin
(log10) minimum value of the triangular distribution representing log10 reduction (scalar).
- logIntervMode
(log10) mode value of the triangular distribution representing log10 reduction (scalar).
- logIntervMax
(log10) maximum value of the triangular distribution representing log10 reduction (scalar).
Value
A list of four elements:
- N
(
CFU) A matrix of sizenLotslots bysizeLotunits representing the numbers of L. monocytogenes per pack unit after post-packaging intervention;- ProbUnitPos
Probability that the lot is contaminated after post-packaging intervention (a lot is considered contaminated if at least one pack remained contaminated after the intervention) (vector);
- P
Mean prevalence of contaminated lots after post-packaging intervention (scalar);
- pSurvReduction
Probability of a microbial cell to survive the post-packaging intervention (vector).
References
Team RC (2022). R: A Language and Environment for Statistical Computing. R Foundation for Statistical Computing, Vienna, Austria. https://www.R-project.org/.
Pouillot R, Delignette-Muller M (2010). “Evaluating variability and uncertainty in microbial quantitative risk assessment using two R packages.” International Journal of Food Microbiology, 142(3), 330-40.
