Cross-contamination during freezing/packaging and partitioning into packed units
Source:R/fvPartitioningCC.R
fvPartitioningCC.RdThe fvPartitioningCC() function simulates the potential re-contamination of vegetables post-blanching, when in direct
contact with contaminated surfaces of conveyors, freezer or packaging machine, followed by the partitioning of the bulk
of frozen vegetables into packed units.
The cross-contamination algorithm accounts for four possible scenarios:
cross-contamination occurring in lots already contaminated;
re-contamination occurring in lots that were not contaminated;
no cross-contamination occurring in lots already contaminated; and
no cross-contamination occurring in lots that were not contaminated.
Probabilities of occurrence of every event are computed. The partitioning algorithm randomly distributes the total numbers of cells from a
contaminated lot into packed units. The dispersion factor b, which is a parameter of the beta distribution, indicates the
extent of cell clustering in the bulk of frozen vegetables in a lot, and ultimately the heterogeneity in the number of cells
distributed among pack units.
Usage
fvPartitioningCC(
  data = list(),
  nLots = NULL,
  sizeLot = NULL,
  probCC,
  trMean = -0.44,
  trSd = 0.4,
  nEquip,
  bCCFV
)
Arguments
- data
a list of:
N(
CFU) A matrix of sizenLotslots bysizeLotunits containing the numbers of L. monocytogenes in blanched units or portions from contaminated lots;PMean prevalence of contaminated lots (scalar);
ProbUnitPosProbability of individual lots being contaminated (vector).
- nLots
Number of lots sampled or size of the Monte Carlo simulation (scalar).
- sizeLot
Number of units or portions produced in a lot (scalar).
- probCC
Probability of cross-contamination of vegetables from conveyors, freezer or packaging machine (scalar).
- trMean
Mean parameter of the normal distribution representing the variability in the log 10 of the transfer coefficient of L. monocytogenes cells from surfaces to (frozen) vegetables (scalar or vector).
- trSd
Standard deviation parameter of the normal distribution representing the variability in the log 10 of the transfer coefficient of L. monocytogenes from surfaces to (frozen) vegetables (scalar or vector).
- nEquip
(
CFU) Numbers of L. monocytogenes cells on the surface of conveyors, freezer or packaging machine in contact with the (frozen) vegetables (scalar or vector).- bCCFV
Dispersion factor of the beta distribution representing the degree of heterogeneity in the number of cells between pack units (scalar).
Value
A list of three elements:
N(
CFU) A matrix of sizenLotslots bysizeLotunits representing the numbers of L. monocytogenes per pack unit, from contaminated lots;ProbUnitPosProbability of individual lots being contaminated after packaging (a lot is considered contaminated if at least one pack unit is contaminated) (vector);
PMean prevalence of contaminated lots after packaging (scalar).
Note
The value of \(probCC=0.125\) is taken from Truchado et al. (2021) , who analysed the presence of L. monocytogenes on conveyor belts, freezing tunnels and packaging machines in frozen food processing plants. The value of beta=1 represents moderate clustering of cells in the bulk of frozen vegetables from a lot Nauta (2005) . Hoelzer et al. (2012) established the log 10 of the transfer coefficient of L. monocytogenes from stainless steel to vegetables as a normal distribution with \(TR\_mean=-0.44\) and \(TR\_sd=0.40\).
References
Truchado P, Gil MI, Allende A (2021). “Peroxyacetic acid and chlorine dioxide unlike chlorine induce viable but non-culturable (VBNC) stage of Listeria monocytogenes and Escherichia coli O157:H7 in wash water.” Food Microbiology, 100, 103866. doi:10.1016/j.fm.2021.103866 , cited By 2. Hoelzer K, Pouillot R, Gallagher D, Silverman MB, Kause J, Dennis SB (2012). “Estimation of Listeria monocytogenes transfer coefficients and efficacy of bacterial removal through cleaning and sanitation.” International Journal of Food Microbiology, 157, 267-77. doi:10.1016/j.ijfoodmicro.2012.05.019 . Nauta MJ (2005). “Microbiological risk assessment models for partitioning and mixing during food handling.” International Journal of Food Microbiology, 100(1), 311–322. doi:10.1016/j.ijfoodmicro.2004.10.027 . Wolodzko T (2020). extraDistr: Additional Univariate and Multivariate Distributions. R package version 1.9.1, https://CRAN.R-project.org/package=extraDistr. Pouillot R, Delignette-Muller M (2010). “Evaluating variability and uncertainty in microbial quantitative risk assessment using two R packages.” International Journal of Food Microbiology, 142(3), 330-40. Boshnakov GN (2022). “Rdpack: Update and Manipulate Rd Documentation Objects.” doi:10.5281/zenodo.3925612 , R package version 2.4. Team RC (2022). R: A Language and Environment for Statistical Computing. R Foundation for Statistical Computing, Vienna, Austria. https://www.R-project.org/. FDA (2021). “FDA-iRISK 4.2 Food Safety Modeling Tool: Technical Document.” U.S. Food and Drug Administration.
Author
Ursula Gonzales-Barron ubarron@ipb.pt and Regis Pouillot rpouillot.work@gmail.com
Examples
dat <- Lot2LotGen(
nLots = 50,
sizeLot = 100,
unitSize = 500,
betaAlpha = 0.5112,
betaBeta = 9.959,
C0MeanLog = 1.023,
C0SdLog = 0.3267,
propVarInter = 0.7
)
Nf <- fvPartitioningCC(dat,
probCC = 0.125, trMean = -0.44,
trSd = 0.40, nEquip = 500, bCCFV = 1
)
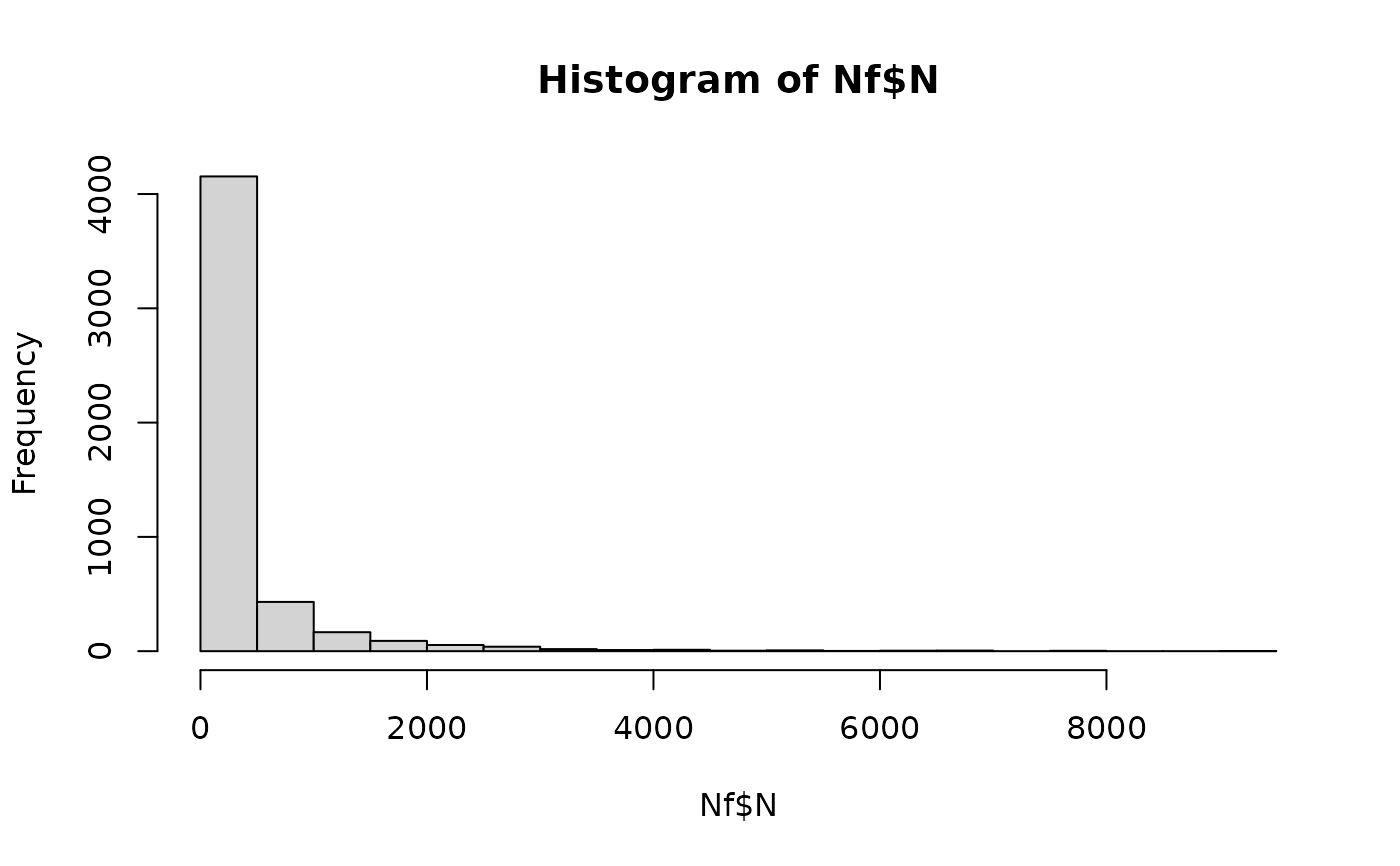
hist(Nf$N) # displays histogram of cells in a pack from contaminated lots