Cross-contamination of cantaloupe rind by L. monocytogenes during harvest
Source:R/caHarvestCC.R
caHarvestCC.RdThe function caHarvestCC() simulates cross-contamination that might occur at the moment of harvesting from elements such as conveyors,
crates or plastic surfaces. This function can be used for cantaloupes harvested in large farms (intended for RTE and
sold as whole cantaloupe in formal retail) and in small farms (intended for traditional markets). Parameters to be changed accordingly.
Usage
caHarvestCC(
  data = list(),
  probCCH,
  trMean,
  trSd,
  nPlas,
  nLots = NULL,
  sizeLot = NULL
)
Arguments
- data
a list of
N(
CFU) A matrix of size:nLotsbysizeLotcontaining the numbers of L. monocytogenes on the rind of cantaloupes from contaminated cultivation lotsPPrevalence of contaminated cultivation lots (scalar)
- probCCH
Probability of cross-contamination during harvest
- trMean
Mean of the normal distribution describing the variability in the transfer coefficient from the surface of elements to rind (scalar)
- trSd
Standard deviation of the normal distribution describing the variability in the transfer coefficient from the surface of elements to rind (scalar)
- nPlas
(
CFU) Numbers of L. monocytogenes on food contact surfaces (conveyors or crates at harvest) touching the cantaloupes (scalar)- nLots
Number of cultivation lots
- sizeLot
Number of cantaloupes cultivated and harvested in a lot
Value
A list of two elements:
N(CFU) A matrix of size
nLotsbysizeLotof L. monocytogenes numbers on the rind of cantaloupes from contaminated harvested lotsPPrevalence of harvested contaminated lots
Note
The algorithm evaluates the cross-contamination event at cantaloupe level (and not at cultivation lot level), assuming that
every cantaloupe has the same probability probCCH of being contaminated from conveyors, crates or other surfaces during harvesting.
References
Team RC (2022). R: A Language and Environment for Statistical Computing. R Foundation for Statistical Computing, Vienna, Austria. https://www.R-project.org/.
Author
Ursula Gonzales-Barron ubarron@ipb.pt and Regis Pouillot rpouillot.work@gmail.com
Examples
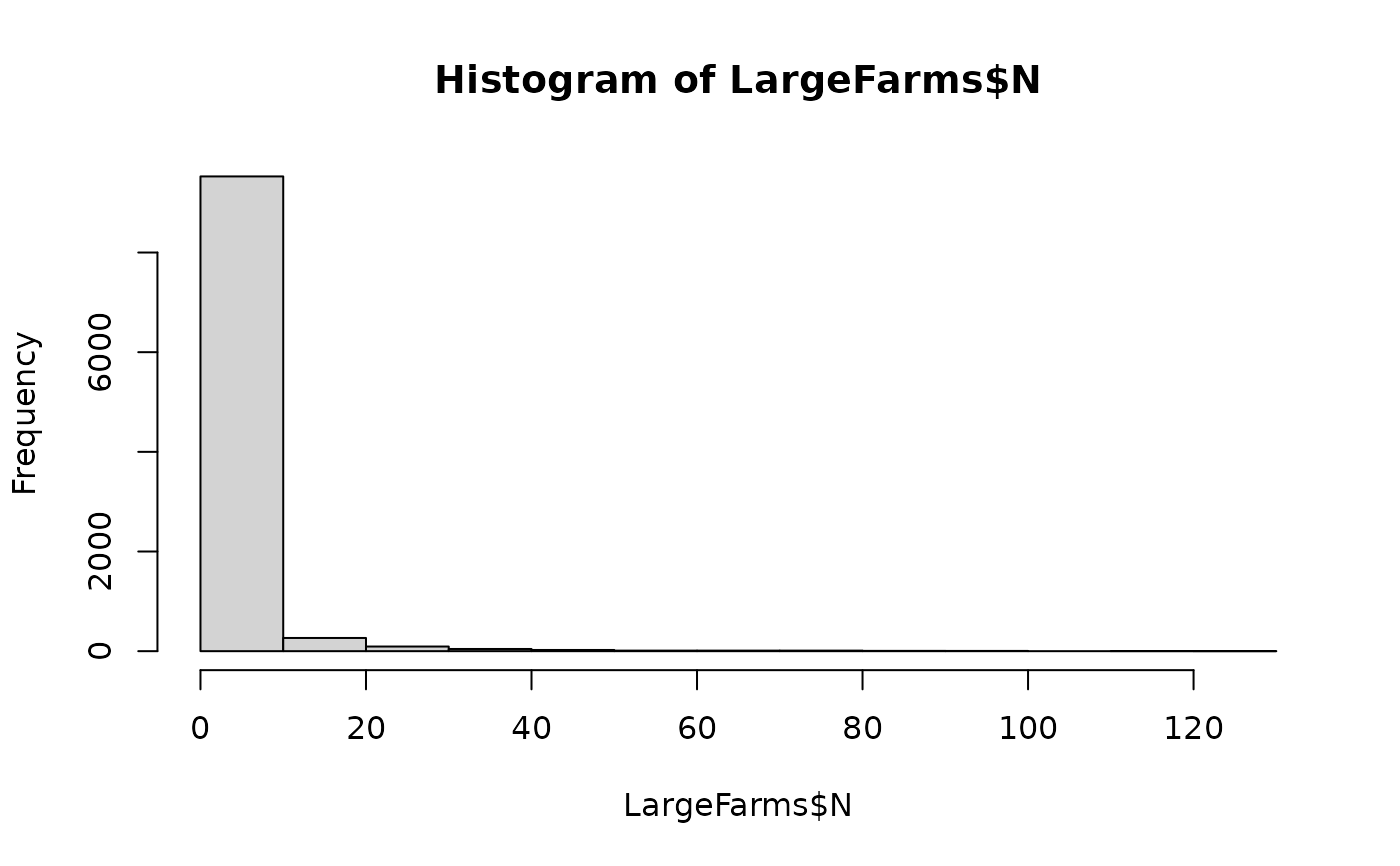
# Example of use in LARGE production farms
dat <- caPrimaryProduction(
nLots = 100,
  sizeLot = 100)
probCCH <- 0.005
LargeFarms <- caHarvestCC(dat,
                          probCCH = probCCH,
                          trMean = -1.42,
                          trSd = 0.52,
                          nPlas = 200
                          )
hist(LargeFarms$N)

probCCH <- 0.02
nPlas <- 500
SmallFarms <- caHarvestCC(dat,
                          probCCH = probCCH, trMean = -1.42,
                          trSd = 0.52, nPlas = 500,
                          nLots = 100, sizeLot = 100
                          )
                          hist(SmallFarms$N)
probCCH <- 0.02
nPlas <- 500
SmallFarms <- caHarvestCC(dat,
probCCH = probCCH, trMean = -1.42,
trSd = 0.52, nPlas = 500,
nLots = 100, sizeLot = 100
)
hist(SmallFarms$N)