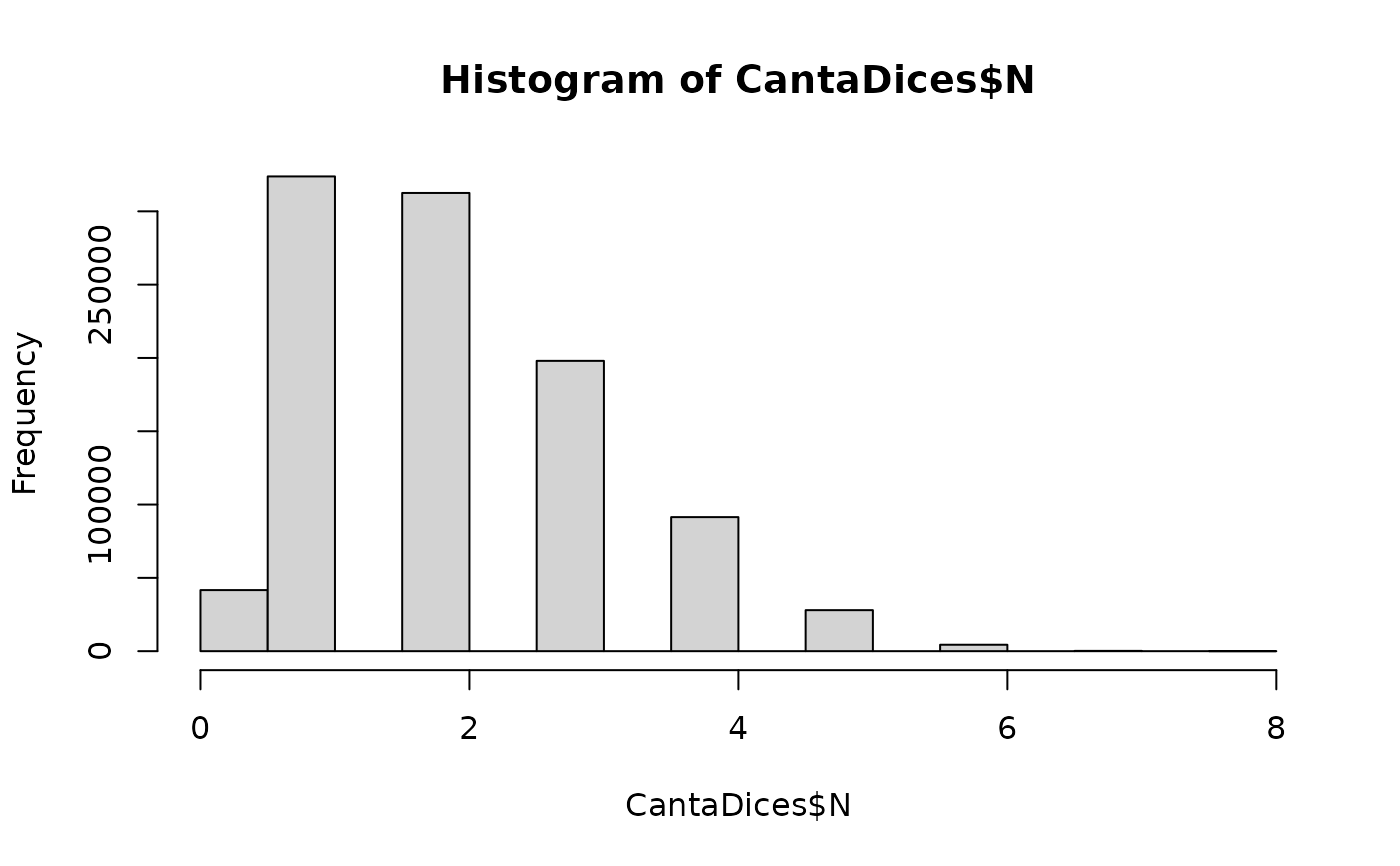
The function caDicing() simulates the transfer of L. monocytogenes from rind to flesh during dicing
of cantaloupe at processing environment. It is assumed that every cantaloupe is separately diced,
and if contaminated on the rind, a fraction of L. monocytogenes cells is transferred to the dices.
Notice that this function does not consider cross-contamination from dicing machine or from knives.
The transfer rate (TR) in % (CFU/g dices per \(CFU/cm^2\ rind)*100\) has been modelled as a Pert distribution
with parameters minTR, modeTR and maxTR.
Usage
caDicing(
  data = list(),
  minTR = 0.087,
  modeTR = 0.55,
  maxTR = 2.82,
  cantaSurface = 580,
  cantaRindFree = 950,
  sizeSublot
)
Arguments
- data
a list of:
N(
CFU) A matrix of sizenLotslots bysizeLotunits representing the numbers of L. monocytogenes on cantaloupe rind, from contaminated lots;PPrevalence of contaminated harvested lots (scalar).
- minTR
(
%) Minimum transfer rate from rind to flesh (\(default=0.087\) for use in a Pert distribution) (scalar).- modeTR
(
%) Mode of the transfer rate from rind to flesh (\(default=0.55\) for use in a Pert distribution) (scalar).- maxTR
(
%) Maximum transfer rate from rind to flesh (\(default=2.82\) for use in a Pert distribution) (scalar).- cantaSurface
(\(cm^2\)) Surface area of a cantaloupe (scalar or vector).
- cantaRindFree
(
g) Weight of a seedless rind-free cantaloupe equivalent to the weight of dices from one cantaloupe (scalar or vector).- sizeSublot
Number of cantaloupes to be diced in a sublot or processing lot (the sizeSublot should be multiple of sizeLot) (scalar).
Value
A list of two elements:
N(
CFU) A matrix in the sublot arrangement sizenewMCsublots by sublot_size portions of dices from one cantaloupe representing the numbers of L. monocytogenes in dices, from contaminated production lots.PPrevalence of sublots of dices contaminated with L. monocytogenes(scalar).
Note
The matrix N is returned in a sublot arrangement, meaning that the number of rows corresponds to the number of sublots,
and the number of columns the number of cantaloupes processed in a sublot. This is done because the production lot size is not
necessarily the same as the processing lot size. Therefore, the numbers and prevalence outputs are given in the sublot basis (processing lot).
The variability in the transfer rate from rind to flesh (CFU/g dices per \(CFU/cm^2\) rind) was modelled as a Pert distribution using data
digitised from Ukuku and Fett (2002)
and Ukuku et al. (2012)
.
References
Pouillot R, Delignette-Muller M (2010). “Evaluating variability and uncertainty in microbial quantitative risk assessment using two R packages.” International Journal of Food Microbiology, 142(3), 330-40. Ukuku DO, Fett W (2002). “Behavior of Listeria monocytogenes inoculated on cantaloupe surfaces and efficacy of washing treatments to reduce transfer from rind to fresh-cut pieces.” Journal of Food Protection, 65(6), 924-930. doi:10.4315/0362-028X-65.6.924 . Ukuku DO, Olanya M, Geveke DJ, Sommers CH (2012). “Effect of native microflora, waiting period, and storage temperature on Listeria monocytogenes serovars transferred from cantaloupe rind to fresh-cut pieces during preparation.” Journal of Food Protection, 75(11), 1912-1919. doi:10.4315/0362-028X.JFP-12-191 .
Author
Ursula Gonzales-Barron ubarron@ipb.pt

